This is independent research, built against the odds with limited resources and a lot of determination. It is
shared in that spirit — open, still rough in places, and meant to be improved by others. Corrections,
challenges, and contributions are all welcome.
The analysis is built on EU MRV data, which has specific scope and specific gaps. Honesty about these limits
is part of the methodology.
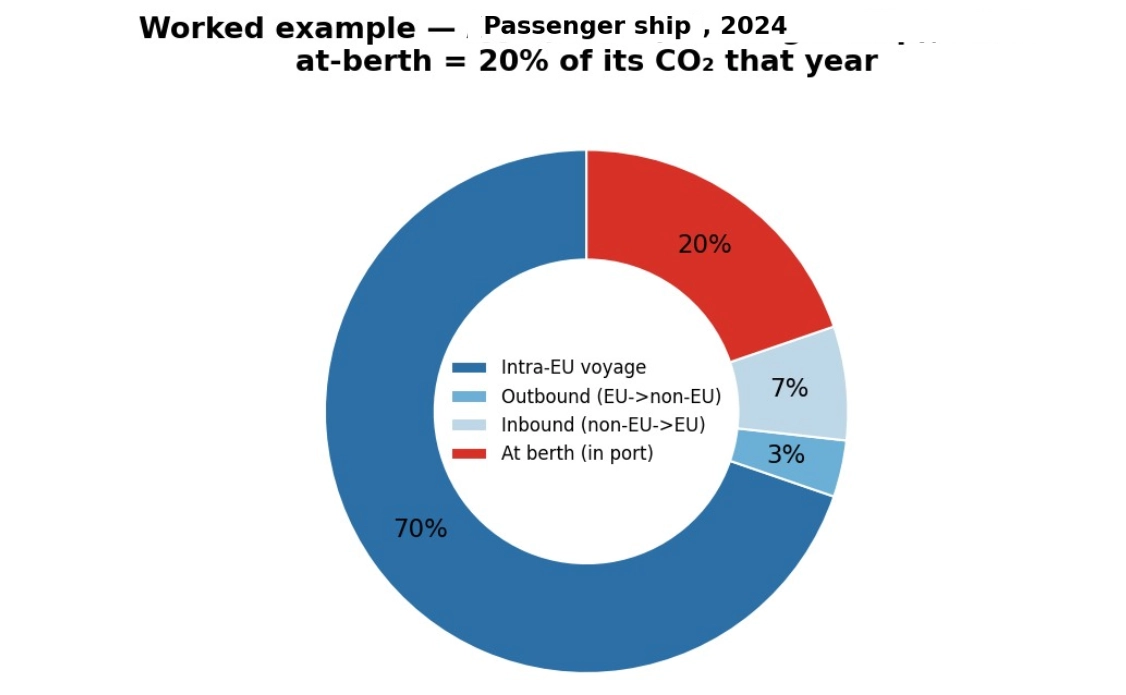
The data is European in scope. Ships are required to report only their EU-related emissions — voyages to or
from EU ports, and time at berth in EU ports. A vessel that spends most of its year in Asia and only
occasionally calls at Rotterdam will have most of its operational reality outside the dataset. The analysis
reflects EU-scope behaviour, not global behaviour.
The most recent data covers 2024 emissions, reported in 2025. There is always a delay between operational year
and reporting year. The platform reflects what has been published; emerging changes in operations do not
appear immediately.
The CII calculation here is simplified. The IMO’s full method includes correction factors for fuel type, ice
class, refrigeration, shuttle tankers, and voyage exclusions. The simplified version uses CO₂ equivalent per
capacity per nautical mile. For ice-class vessels, LNG-fuelled ships, or refrigerated cargo carriers, the
simplified rating reads slightly worse than the official rating would. The simplified version is appropriate
for relative comparison and trend analysis; it is not the certified IMO rating.
The capacity divisor uses deadweight tonnage for cargo ships and gross tonnage for non-cargo ships, following
standard maritime industry convention. The division produces emissions per unit of carrying capacity, not per
unit of cargo actually carried. A vessel sailing half-empty looks the same as one sailing full.
The analysis cannot account for many real-world factors that affect a ship’s measured efficiency. Port stays,
anchorage time, frequency of port calls, weather routing, hull condition, crew quality, charterer behaviour,
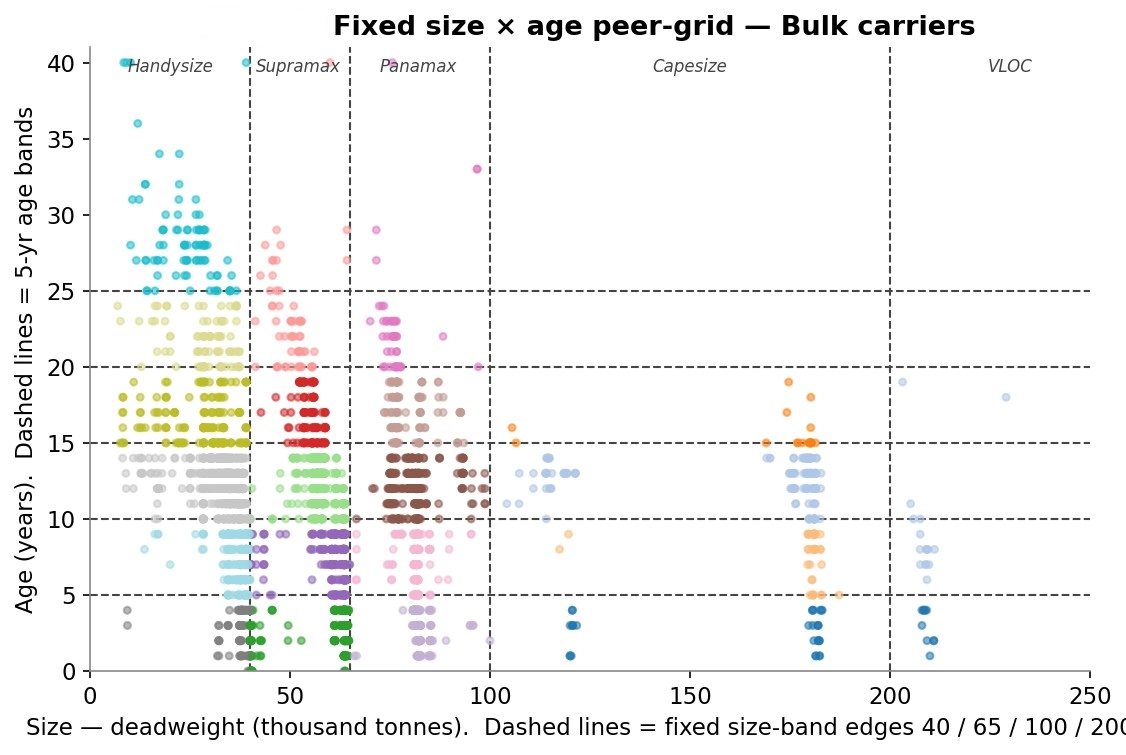
and trade pattern all influence what the numbers show. The peer grouping controls for type, size, and age. It
does not control for these operational realities.
This is statistical analysis. It is not a replacement for engineering inspection, technical due diligence, or
operational audit. The output is structured insight from public data, intended to inform decisions, not to
substitute for direct examination of a vessel or operator.