

Plain question: of all the CO₂ a ship reports, how much is burned at sea on each kind of voyage — and how much while it simply sits in port?
Output: the four-segment split per ship-year (validated against the total), the fleet/type composition, and an absolute at-berth footprint ranked per ship and per operator.
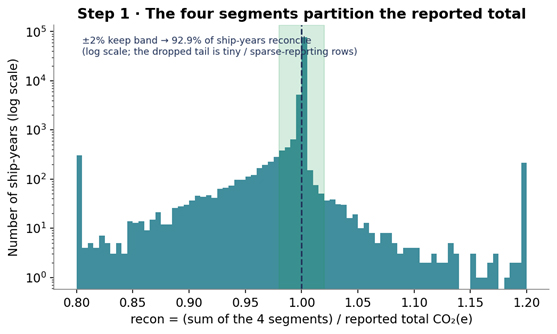
Coverage: 83,589 of 90,012 ship-years (92.9%) reconcile and feed every chart; the at-berth leaderboard covers 18,582 ships and 2,239 operators.
What makes this insight different: every other insight derives a metric — a grade, a rank, a rate. This one derives nothing — it reads the raw reported tonnes by location and only validates that the four parts add back to the total. It answers not how much a ship emits but where, which unlocks two distinct decisions: shore-power retrofits (berth vs sea) and ETS exposure (intra-EU vs international, the latter only 50%-counted).
The big picture — four steps
- Validate the split — load the four EU-scope buckets and confirm they partition the reported total.
- Fleet composition — stack the segments into the fleet's mix, year by year.
- By type — break the mix down by ship type.
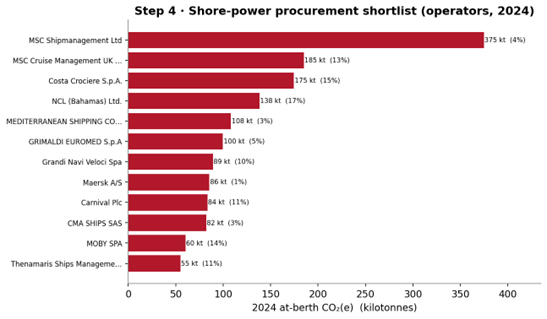
- Port-stay footprint — rank the absolute at-berth footprint per ship and per operator (the shore-power shortlist).
In one sentence: split each ship's reported CO₂ into intra-EU / outbound / inbound / at-berth, confirm they partition the total, and stack them by year, by type, and by operator — exposing both the port-stay footprint shore power can abate and the intra-EU-vs-international geography that drives ETS scope.
The four EU-scope buckets
EU MRV reports each ship-year's CO₂ split into four mutually-exclusive buckets that sum to the ship's EU-scope total. The first three are voyage carbon (by where the voyage starts and ends relative to the EU); the fourth is carbon burned while at berth.
| Bucket | What it is | Why it matters |
|---|---|---|
| Intra-EU voyage | both ends are EU ports | fully in EU ETS scope (100%) |
| Outbound (EU→non-EU) | leaves an EU port for a non-EU one | an international leg — 50%-counted under ETS |
| Inbound (non-EU→EU) | arrives at an EU port from a non-EU one | an international leg — 50%-counted under ETS |
| At berth (in port) | moored/manoeuvring in an EU port | the slice shore power/cold-ironing can abate |
Table. The four reported segments (analytics SEG_COLS). Two readings live inside them: berth-vs-sea (shore power) and intra-EU-vs-international (ETS scope).
GHG basis. Like the other insights, the basis switches to CO₂eq from 2024. The swap is whole-row — the total and all four segments move to CO₂eq together (only when the entire CO₂eq block is present), so the reconciliation never compares a CO₂eq part against a CO₂ total.
Step 1 — Confirm the split partitions the total
Before trusting a composition we check it actually is one. For each ship-year we sum the four segments and divide by the reported total; we keep only rows that reconcile to within 2%.
recon = (sum of the 4 segments) / reported total CO₂(e)
keep the ship-year if 1 − 0.02 ≤ recon ≤ 1 + 0.02
the kept set (seg_ok) is the ground truth for every chart — raw reported tonnes by location, no model.
Step 2 — The fleet's carbon, by location, year by year
Pooling every kept ship-year, what share of the whole fleet's EU-scope CO₂ falls in each bucket each year? This is CO₂-weighted — tonnes per segment ÷ the fleet total — so big ships count for more, which is what we want when the question is where the tonnes are.
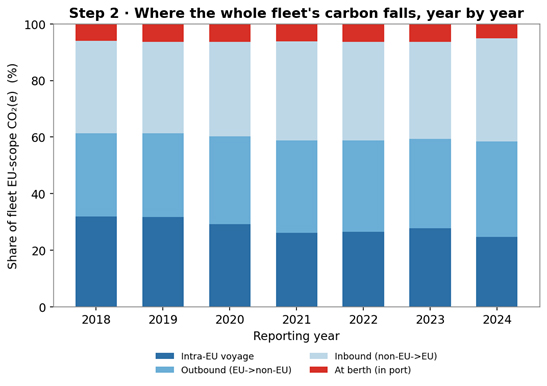
The at-berth band looks negligible at ~5% of fleet carbon — until Step 3 shows it is wildly concentrated: irrelevant for a bulk carrier, but a major slice for ships that spend their lives turning around in port.
Step 3 — Different ships emit in different places
The fleet average hides everything interesting, because operating pattern is a property of ship type. We compute each type's own segment mix (again CO₂-weighted, within the type) and sort so the most berth-heavy types rise to the top.
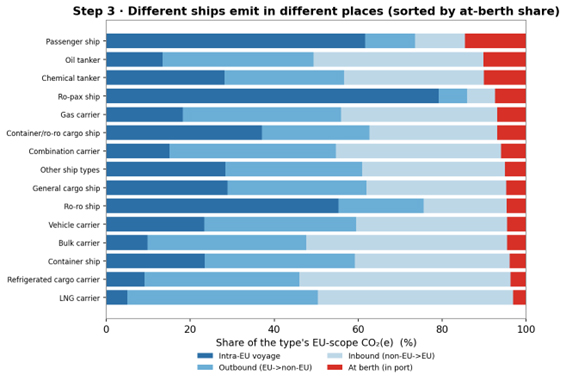
Read it: the heaviest at-berth shares are Passenger ship (15%), Oil tanker (10%), Chemical tanker (10%) — long port stays (hotel load, loading/discharge); the lightest are LNG carrier (3%), Refrigerated cargo carrier (4%), Container ship (4%) — almost pure voyage carbon. The voyage mix splits them too: ferries and short-sea ships lean intra-EU, deep-sea trades lean international. So "decarbonise the port stay" and "decarbonise the voyage" are aimed at completely different fleets — the practical payoff of splitting the number.
Step 4 — The port-stay footprint: who gets shore power first?
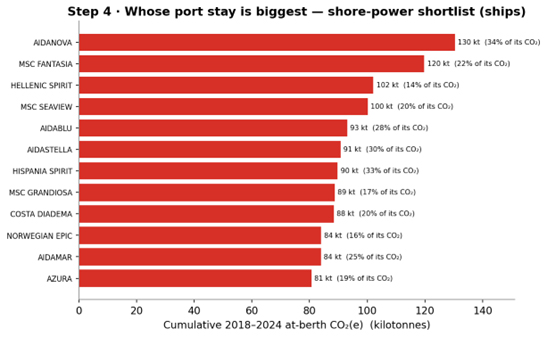
At-berth carbon is the slice with an off-the-shelf fix: plug the ship into the grid (shore power / cold-ironing) and quayside emissions go to near-zero. So the actionable question is whose at-berth footprint is biggest in absolute tonnes — because that is what a retrofit actually abates. We rank ships by their cumulative 2018–2024 at-berth CO₂ (flooring out marginal vessels below 5,000t total) and roll the same figure up to the 2024 operator.
Worked example — one ship's split
IMO 9781865 (AIDANOVA), a passenger ship, tops the at-berth leaderboard. Its split makes the two readings concrete.
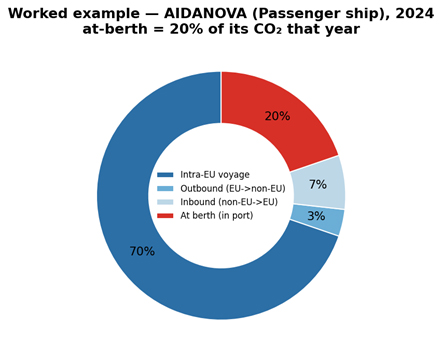
| Quantity | Value | How |
|---|---|---|
| 2024 reconciliation | recon = 1.000 | 4 parts sum to within ±2% → kept |
| 2024 at-berth share | 20% | co2_berth ÷ that year's total |
| cumulative at-berth (2018–2024) | 130 kt | sum of co2_berth over reconciled years |
| cumulative at-berth share | 34% | 130 kt ÷ 389 kt total |
| shore-power verdict | high-priority | large absolute abatable tonnes at the quay |
Table. The Port Emission Split computation for AIDANOVA, reproduced from mrv.db.
Reading it: about a third of this ship's entire EU-scope carbon (130 kt over the window) is burned sitting at the quay — a single vessel whose port stays alone exceed the total annual emissions of many cargo ships. Connect it to shore power and most of that disappears; that is why the absolute-tonnes ranking, not the percentage, is the procurement signal.
Outputs, uses, and honest limits
What the insight emits. Per ship-year: the four segment tonnes, recon, seg_ok, and the at-berth share. Per ship: cumulative berth_t / total_t / berth_share. Per operator (2024): the same. Fleet-wide: segment shares by year and by type.
Why it makes sense and adds value. It is raw and auditable — no model, no derived metric, just the reported tonnes by location, validated to add up. It is directly actionable — the absolute at-berth ranking is a literal shore-power procurement shortlist. It informs compliance — the intra-EU-vs-international geography maps onto ETS 50%-scope exposure.
Honest limits. 7% of ship-years don't reconcile (near-zero totals or blank parts) and are dropped — they are tiny, not a systematic gap. The four buckets are EU-scope segments, not individual ports; a true port-by-port map needs port-call detail the MRV files don't carry. Operators are only published from 2024, so the operator leaderboard is a single-year (2024) view, while the per-ship leaderboard is cumulative across the window. And per-ship cumulative footprints mix bases across years (2024 CO₂eq + earlier CO₂, ~1–2%), but berth_share is a ratio so the mix largely cancels.