

Plain question: given a carbon-intensity target that tightens every year, who is compliant today, who slides into D/E by 2030 on present behaviour, and how fast would they have to improve to avoid it?
Output per ship: the 2024 A–E CII rating, a year-by-year projection to 2030 under two scenarios (frozen / trend), the compliance cliff year, and the annual cut needed to stay C-or-better.
Coverage: 11,769 in-scope 2024 ships rated against the IMO target; the required trajectory is IMO-fixed all the way to 2030.
The big picture
The whole insight rests on one comparison, per ship, per year — attained vs required CII — turned into an A–E rating. The twist that makes it a projection rather than a snapshot: the required target drops a few percent every year, so a ship that changes nothing drifts to a worse rating over time.
- Rate today — attained vs required CII → an A–E rating against today's target.
- Show the moving goalpost — watch one ship's frozen attained against the descending target — the grade decays.
- Project the fleet — roll every ship to 2030 under frozen and trend behaviours; record the cliff year.
- Prescribe — compute the annual cut each ship needs to stay C-or-better.
Step 1 — Attained vs required, rated A–E
Two quantities, per ship:
attained CII = CO₂e(g) / (Capacity × distance)   [ = AER ]
required CII = reference · (1 − Z/100), reference = a · Capacity^(−c)
attained uses the ship's actual capacity (DWT cargo / GT pax); the reference clamps capacity per band. Both come from the validated IMO constants in db/cii_reference_data.py.
The reduction factor Z tightens the 2019 reference line each year — and it is IMO-fixed for every year to 2030:
| Year | 2023 | 2024 | 2025 | 2026 | 2027 | 2028 | 2029 | 2030 |
|---|---|---|---|---|---|---|---|---|
| Z (%) | 5.0 | 7.0 | 9.0 | 11.0 | 13.625 | 16.25 | 18.875 | 21.5 |
Table. The IMO reduction factor Z (2023–2026 original, 2027–2030 the adopted strengthened factors). The required line in 2030 is 21.5% below the 2019 reference — a fixed target, not an extrapolation.
ratio = attained / required → rating: <d1 A · <d2 B · <d3 C · <d4 D · ≥d4 Ethe C band straddles ratio = 1.0, so a ship near 1.0 is "on target," not failing.
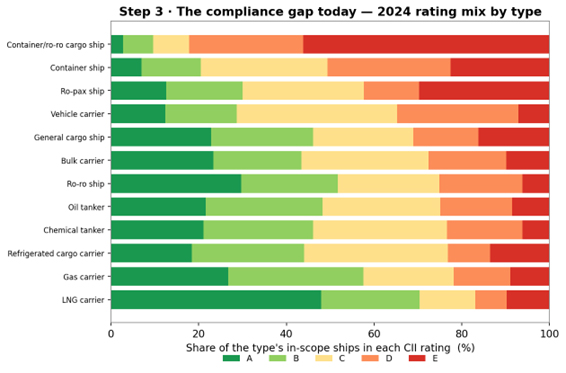
The 2024 starting mix across the in-scope fleet: A 2,364 · B 2,474 · C 3,240 · D 2,183 · E 1,508 (31.4% already in D/E by ship count). From 2024 the attained CII rides on CO₂eq, so the reference line is lifted by each type's CO₂eq rebase to keep the comparison consistent (see the Peer Benchmarking methodology).
Step 2 — The moving goalpost
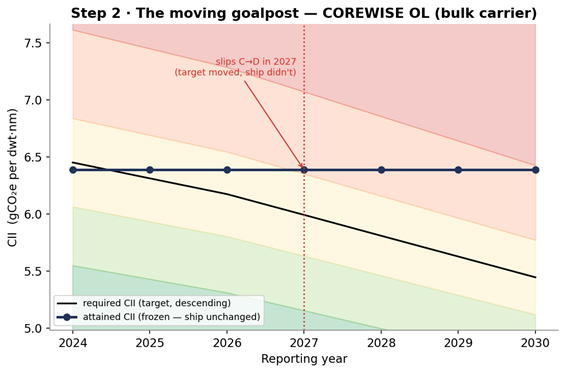
Here is the mechanic that turns a snapshot into a projection. Freeze one ship's attained CII and watch its required CII descend as Z grows. The A–E zones are defined relative to required, so they slide down with the target — walking a ship from C into D without the ship changing a thing.
Step 3 — The compliance gap today
Before projecting, fix the present. For 2024 we show each type's rating mix — the share of its ships in each A–E band against the current target, sorted by the D/E (at-risk) share. This is the structural distance each segment sits from its own yardstick today.
Step 4 — Project to 2030: two scenarios and the cliff
Every in-scope ship is rolled forward to 2030 under two behaviours, rating it each year and recording its compliance cliff — the first year it tips into D/E:
- Frozen — attained held at its 2024 value. This isolates the effect of the target tightening.
- Trend — attained projected along the ship's own historical pace — the log-linear slope of its attained CII over 2018–2024 (needs ≥ 4 years; ships with less fall back to frozen). The slope is clipped to ±10%/yr so a noisy short history can't manufacture a runaway.
attained(y) = attained(2024) · exp( b · (y − 2024) )
rating(y) = rate( attained(y) / required(y) )
cliff = first y rated D or E
b = 0 for frozen; b = the clipped historical slope for trend.
Across the fleet 8,462 ships have ≥ 4 years of history to carry a real trend; the rest project frozen.
Step 5 — The prescription: how fast must each ship cut?
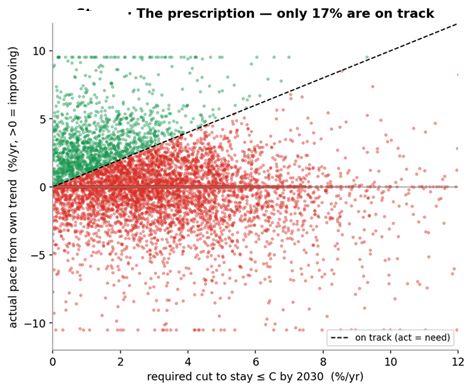
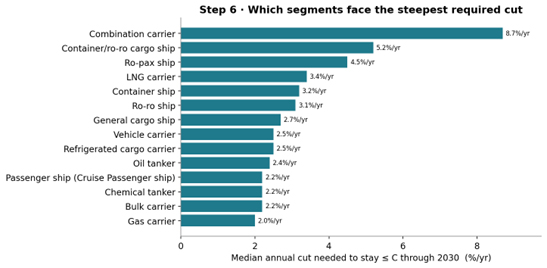
Finally, the actionable number. For each ship we compute the attained ceiling that keeps it C-or-better in 2030, then the annual cut needed to reach it from its 2024 attained, and compare that to the pace it is actually achieving.
target_2030 = d3 · reference · (1 − Z₂₀₃₀/100)   [ the ≤C ceiling in 2030 ]
need_rate = 1 − (target_2030 / attained)^(1/6)   [ annual cut required ]
act_rate = 1 − exp(b_trend)                      [ annual cut achieved ]
shortfall = need_rate − act_rate                 [ >0 = falling short ]
six years from 2024 to 2030; need/act/shortfall as %/yr.
Worked example — one ship, today to 2030
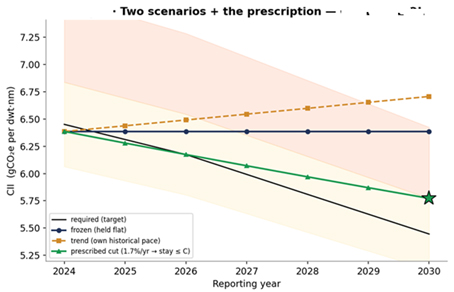
COREWISE OL, a 37,059-dwt bulk carrier, is the clearest kind of case: in 2024 its ratio is 0.99 — almost exactly on target, a solid grade C. Yet it slides into D purely because the target keeps moving, and its own trend makes it slightly worse.
| Quantity | Value | How |
|---|---|---|
| 2024 attained / required | 6.39 / 6.45 | AER vs reference·(1−7%) |
| 2024 ratio → rating | 0.99 → C | on target (C band straddles 1.0) |
| frozen rating path | C C C D D D D | 2024→2030, attained held flat |
| trend rating path | C C C D D E E | 2024→2030, own pace (slightly worsening) |
| compliance cliff | 2027 (frozen) | first year rated D/E |
| 2030 ≤ C ceiling | 5.77 | d3 · ref · (1 − 21.5%) |
| need_rate | 1.7%/yr | cut required to reach the ceiling |
| act_rate | −0.8%/yr | actual pace (negative = worsening) |
| shortfall | 2.5%/yr | need − act |
Table. The full CII Projection computation for COREWISE OL, reproduced from mrv.db.
Reading it: a ship that is compliant today (C, ratio 0.99) but is rated D from 2027 onward if it does nothing — the target simply descends beneath it. To stay C-or-better through 2030 it must cut intensity 1.7%/yr; instead its trend is drifting 0.8%/yr the wrong way, a 2.5%/yr shortfall. That single number is the actionable output.
Outputs and honest limits
What the insight emits. Per ship: the 2024 attained/required/ratio/rating + d1–d4, the trend slope, the frozen and trend cliff years, need_rate / act_rate / shortfall, target_2030, and a projection bundle (required + frozen/trend attained lines + per-year ratings). Fleet-wide: the 2024 rating mix by type, the CO₂-weighted D/E wall (both scenarios), and the median required cut by type. Served on the Ship Explorer CII Projection card (which plots the frozen scenario + the prescribed cut; the trend is computed but not drawn).
Honest limits. This is a simplified CII calculation based on verified EU MRV public data, capturing emissions within the EU regulation's scope. While it lacks the full global coverage of an official CII calculation, it is grounded in actual reported data rather than the AIS-derived, modelled emission profiles most maritime data providers use. The trend is a projection — it extrapolates each ship's own 2018–2024 slope; real trajectories are not log-linear, and a future engine or trade change is not foreseen. And it inherits the CII scope (mapped type, real capacity and activity; the 5,000 GT rule is not gated — sub-threshold ships are flagged indicative) along with the CO₂eq rebase caveat from Peer Benchmarking.