
Plain question: which operators run the cleanest fleets — and is a given company doing better or worse than the companies genuinely like it?
Output per operator: a 0–100 Operator Score (and a percentile, 100 = cleanest), the median score of its 8 nearest look-alike operators, the gap between the two, and that peer list.
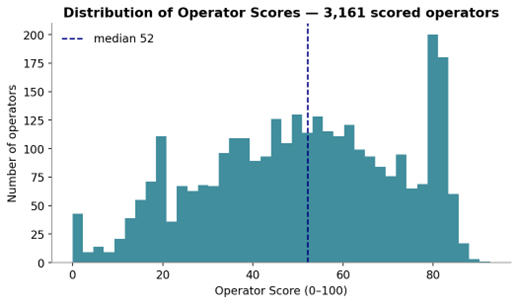
Coverage: 11,737 CII-rated 2024 ships carry a named operator; they roll up into 3,161 scored operators.
The big picture — four ideas in one chain
Peer Benchmarking grades each ship. But charterers, lenders, and regulators ultimately deal with companies, so this insight rolls those grades up to the operator and then makes the company-level comparison fair. The operator is the Document-of-Compliance (DoC) company that actually runs each ship — published in the MRV data only from 2024, which is why this is a 2024 view.
- Recap per-ship grade — carry forward each ship's 0–100 CII efficiency score and its operator.
- Roll up, CO₂-weighted — combine a fleet's ship scores into one Operator Score, weighted by each ship's CO₂.
- Find true peers — describe each operator by a fleet fingerprint and use cosine similarity to find its genuine look-alikes.
- Judge vs true peers — compare each operator's score to the median of its nearest look-alike operators.
In one sentence: grade every ship → CO₂-weight those grades into an Operator Score → fingerprint each fleet and find genuine peer operators by cosine similarity → judge a company against the operators truly like it, not the whole market.
Step 1 — From ship grades to the raw material
We reuse the Peer Benchmarking output exactly: each 2024 ship that is in CII
scope carries an efficiency_score — a 0–100 number derived from its
CII ratio (0 = far above its IMO target, 100 = far below; higher = cleaner) —
together with its operator (the per-year company_imo on
ship_year). Only CII-rated ships count toward a company score;
un-rated ships are ignored, never scored as zero.
11,737 rated ships carry a named operator, spread across 3,292 distinct operators. Most operators are tiny: 59.4% run a single ship and 69.9% run two or fewer. A one-ship "fleet" is just that ship's grade — robust company-level ranking and peer matching therefore become meaningful only above a small fleet size, which is why the downstream charts focus on larger fleets even though every operator is scored.
Step 2 — The Operator Score (CO₂-weighted)
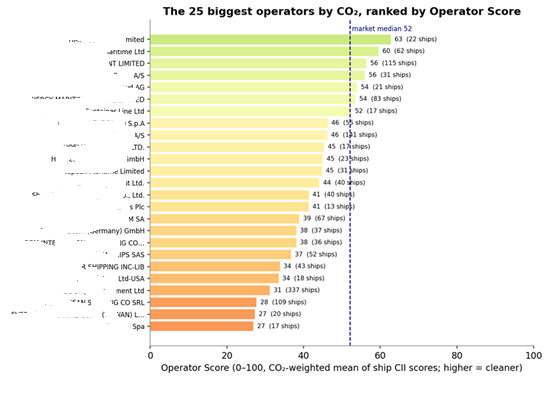
An operator's score is the CO₂-weighted average of its ships' efficiency scores — not a plain mean. The weight is each ship's annual CO₂; if an operator somehow has no CO₂ weight, the code falls back to a simple mean.
Operator Score = Σ( efficiency_score · CO₂ ) / Σ CO₂CO₂-weighted mean over the operator's CII-rated ships (analytics/operator_score.py · _weighted_score).
Why weight by CO₂ and not a simple average? A company's real climate impact is dominated by its biggest, busiest emitters. Weighting by CO₂ means a company is judged mostly on the ships that do most of its emitting — so one token clean vessel cannot offset a fleet of thirsty workhorses. It is the honest way to grade a company rather than its best ship. Across operators of ≥ 5 ships, the weighting shifts the score by ≥ 5 points for 19.7% of them.
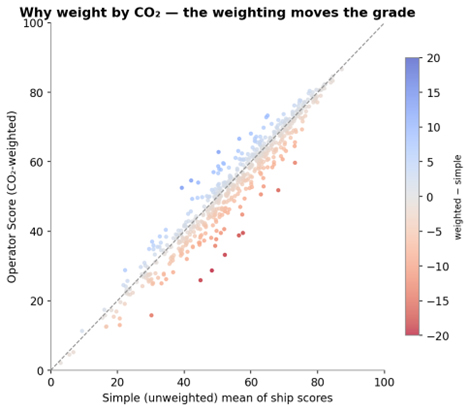
Because the score is the absolute CII rating rolled up — not a forced percentile — the fleet of operator scores spreads across the whole 0–100 range rather than clustering at 50.
Step 3 — Finding each operator's genuine peers
A score only means something against the right comparison set: a cruise operator should not be measured against a container line. So we give each operator a fleet fingerprint — a feature vector describing what kind of fleet it runs — and measure how alike any two operators are. The fingerprint deliberately excludes efficiency, so "similar" means runs the same kind of fleet, never happens to score the same.
The fleet fingerprint
- Ship-type mix — the proportion of the operator's ships in each ship type (a normalised crosstab — e.g. "90% container, 10% bulk").
- Typical size — the mean of log₁₀(size) across its ships (log so a 200,000t and a 20,000t ship are a sensible distance apart).
- Typical age — the mean age of its ships.
All features are standardised (zero mean, unit variance) so no single feature dominates, then every pair of operators is compared with cosine similarity.
similarity(A, B) = cos(θ) = (vₐ · v_b) / (‖vₐ‖ ‖v_b‖)1.0 = identical kind of fleet, 0 = unrelated, negative = opposite profiles. (StandardScaler + cosine_similarity over the fingerprint matrix.)
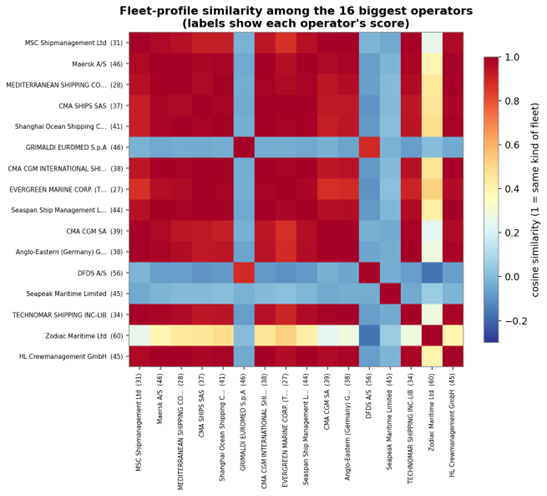
The key safeguard. Because the fingerprint ignores efficiency, the peer set is built purely from what a company operates. That is what lets the next step ask the fair question: are you cleaner than the companies genuinely like you — rather than cleaner than a cruise line you have nothing in common with?
Step 4 — Cleaner than your true peers?
For each operator we take its K = 8 nearest look-alike operators (highest cosine similarity) and compare its Operator Score to their median. The gap is the segment-neutral competitive signal.
peer median = median( Operator Score of the 8 nearest operators )
vs_peers = Operator Score − peer median
positive = cleaner than the companies most like it; negative = dirtier than its true peers.
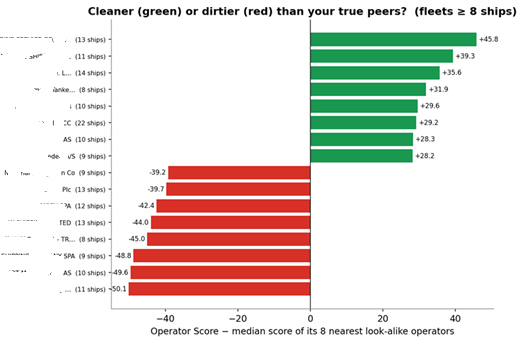
The whole-market league table (Step 2) is unfair to entire segments — every cruise line looks "bad." The vs_peers gap fixes that: it measures a company only against its own kind, so a strongly negative gap is an operational, addressable shortfall — exactly the lever a charterer, lender, or regulator would press on.
Worked example — one operator, end to end
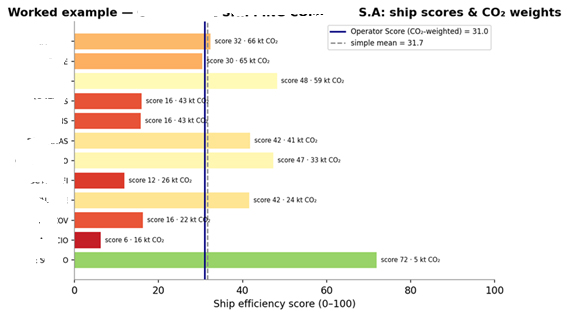
Here is the full computation for Costamare Shipping Company S.A., a 12-ship
container operator, straight from mrv.db.
Step 2 · roll its ship scores up, CO₂-weighted
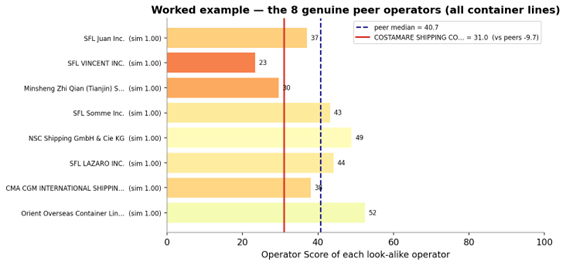
Steps 3–4 · find its true peers and the gap
| Step | Quantity | Value | How |
|---|---|---|---|
| 2 | simple mean of ship scores | 31.7 | unweighted average (for comparison) |
| 2 | Operator Score | 31.0 | CO₂-weighted mean — heavy emitters dominate |
| 2 | standing | 20th percentile | percentile among all scored operators (100 = cleanest) |
| 3 | nearest peers | 8 container lines | cosine ≈ 1.0 on the fleet fingerprint (SFL, CMA CGM, OOCL…) |
| 4 | peer median | 40.7 | median Operator Score of those 8 peers |
| 4 | vs_peers | −9.7 | 31.0 − 40.7 → dirtier than its true peers |
Table. The full Operator Score computation for Costamare Shipping Company S.A., reproduced from mrv.db.
Reading it: a mid-size container operator that is typical-to-clean on a simple average, but whose emissions are concentrated in lower-scoring ships, so its honest (CO₂-weighted) score is 31.0. Measured against the container lines genuinely like it — not the whole market — it runs 9.7 points dirtier than the peer median: an operational shortfall, not a quirk of its business mix.
Outputs, uses, and honest limits
What the insight emits per operator: operator_score (CO₂-weighted), score_simple (for comparison), score_pctile (standing among all operators), peer_median_score, vs_peers, and the peer_operators list (each with company IMO, name, similarity, and score).
Why it makes sense and adds value. It judges the company, not its best ship — CO₂-weighting ties the grade to where the emissions really come from. It is segment-fair — an operator is measured against companies that run the same kind of fleet, so cruise lines are not damned merely for being cruise lines. The negative gap is the lever — a company dirtier than its true look-alikes has an operational, addressable shortfall.
Honest limits. Operator identity is only published in the MRV data from 2024, so this is a 2024 snapshot; year-on-year operator trends are a planned next step. Most operators run one or two ships, so a tiny fleet can top or tail the raw league table on a few ships — exactly why the peer-relative gap (Step 4) matters. The score inherits every Peer Benchmarking caveat (CO₂eq basis from 2024, the 3,000nm activity floor, un-rated types excluded). And the fingerprint captures type/size/age, not trade pattern, so two same-profile operators can still differ on routes — the gap is a strong signal, not a controlled experiment.