

Plain question: is this ship a clean or a dirty performer — compared with ships genuinely like it (same type, size, and age), not against the whole fleet?
Output per ship: an A–E grade (the IMO CII rating), the ship's relative rank within its type, and the single best-in-class peer it can realistically aim at.
Coverage: of 14,431 ships that reported in 2024, 12,112 are benchmarkable and 11,769 receive an A–E CII grade.
The big picture — four ideas in one chain
The insight turns the EU's raw, hard-to-compare CO₂ numbers into a fair, like-for-like grade in four conceptual moves. Everything that follows is an expansion of this chain:
- Define a comparable fleet — pick the 2024 ships that operated enough to judge fairly, and attach their hull particulars (size, age, type).
- Group like with like — inside each ship type, bin ships into fixed size×age peer groups, so every comparison is between genuine equals.
- Measure fairly — measure each ship's carbon intensity for the work it does (AER for cargo, a GT-normalised intensity for passenger/vehicle ships) on a GHG-inclusive (CO₂eq) basis from 2024.
- Grade against the standard — compare that intensity against the ship's IMO CII required line to produce an A–E rating and a 0–100 score; the peer group also yields a relative rank and a best-in-class benchmark.
In one sentence: list the types → split each type into fixed size/age peer groups → measure each ship's CO₂eq intensity → grade it A–E on the simplified CII ratio and rank it against its true peers.
Data foundation — the analysis panel
Every insight in the project starts from one SQL join (the "panel"), built in
eu_mrv/analytics/common.py → load_panel(). It joins three
append-only tables of the project database mrv.db:
| Table | Grain | What it contributes |
|---|---|---|
| ship_static | one row per ship (IMO) | stable hull identity: ship type, technical-efficiency design index |
| ship_year | one row per (ship, year) | the reported annual CO₂ / CO₂eq totals and per-distance intensities, voyage-segment splits, operator |
| enrich_imo | one row per ship | hull particulars: gross tonnage (GT), deadweight (DWT), year of build, flag |
Table. The three sources joined by load_panel(); enrichment is a LEFT JOIN, so a ship with no scraped specs simply has no size/age.
Four physical quantities are derived for every ship-year and reused by all downstream steps. The MRV files contain no distance column, so distance is back-computed from the reported CO₂-per-mile rate — which is why that column is load-bearing.
distance_nm = CO₂(tonnes) × 1000 / co2_per_nmileEU-scope distance sailed in nautical miles (kg ÷ (kg/nm) = nm). Used only for the activity-scope gate.
age = report_year − year_of_buildship age in years at the reporting year.
size_val = DWT for cargo ships, GT for passenger/vehicle ships (the
GT_TYPES split). Passenger and vehicle ships exist to move people and
vehicles, not cargo mass, so deadweight is the wrong size measure for them.
Step 1 — Define the comparable (benchmarkable) fleet
We keep the 2024 ships that can be judged fairly: they must have a known type, a
real size and age, a valid reported CO₂-per-mile, and genuine EU activity. Ships
that barely operated in EU waters (under 3,000 nautical miles for the year — the
ACTIVITY_FLOOR_NM constant) are dropped: you cannot judge a full
year's efficiency from a few days of sailing, and including them would falsely
crown low-activity ships as "best performers."
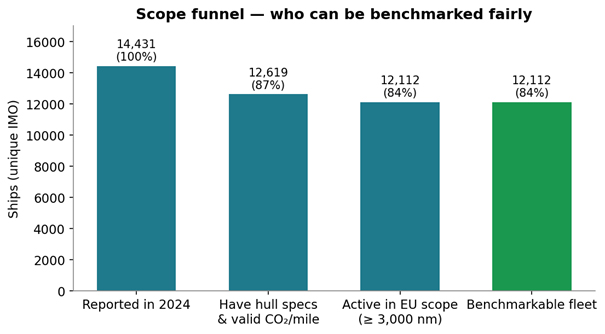
Of the benchmarkable fleet, 11,769 ships receive an A–E grade; 343 stay ungraded because their MRV type has no IMO CII reference line (generic "Passenger ship" / "Other ship types"). They are never silently rated.
Step 2 — Two families, two fair yardsticks
Ranking ships by total CO₂ would just rank them by size and how much they sailed — the biggest, busiest ships always "lose," even when they are the most efficient way to move cargo. A fair yardstick has to measure carbon intensity per unit of work. The fleet splits into two families that earn their keep differently, so each uses its own intensity measure.
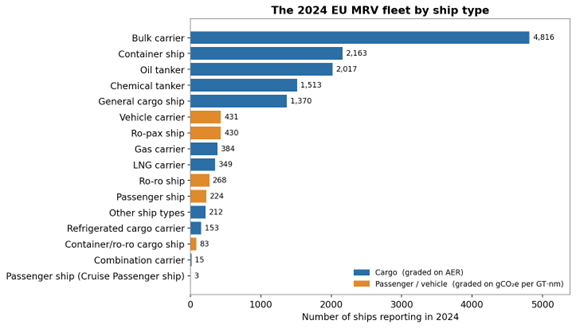
Cargo ships — AER (Annual Efficiency Ratio). Grams of CO₂(e) to move one tonne of cargo capacity one nautical mile. Big ships emit more per mile but carry far more cargo, and only AER credits that. It's the same metric the IMO and bank lenders (the Poseidon Principles) use. Lower = cleaner.
AER = intensity(kg/nm) × 1000 / DWT(tonnes) [ g CO₂e per (dwt·nm) ]Passenger/vehicle ships — GT-normalised intensity. These ships carry people and vehicles, not deadweight cargo, so AER would mislead. Instead we normalise the per-mile intensity by gross tonnage. Lower = cleaner.
pax_intensity = intensity(kg/nm) × 1000 / GT [ g CO₂e per (GT·nm) ]Both yardsticks are gram-based and have the same algebraic form (intensity ÷ capacity), so the two families are unit-consistent.
Step 3 — The greenhouse-gas (CO₂eq) basis switch from 2024
Plain CO₂ understates warming once bio/e-fuels (methanol, LNG methane slip) enter the mix. From the 2024 publication the EU reports CO₂eq (CO₂ + CH₄ + N₂O as CO₂-equivalent). The efficiency metric therefore uses an effective intensity: CO₂eq from 2024 (falling back to plain CO₂ if a 2024 ship is missing the CO₂eq rate), and plain CO₂ for earlier years.
intensity = co2eq_per_nmile if year ≥ 2024 and present, else co2_per_nmilethe effective per-distance intensity (kg/nm) feeding AER, the pax intensity, and the attained CII.
Why this matters for the grade. Because AER, the pax intensity, and the attained CII are all intensity ÷ capacity, the back-computed distance cancels out: the per-mile rate is the load-bearing quantity. Switching the rate to CO₂eq moves all three onto the GHG-inclusive basis in one step — the 2024 grade reflects total warming, not just CO₂.
Step 4 — Building fair peer groups
A ship type on its own isn't a fair comparison set. A bulk carrier can weigh 5,000
or 200,000 tonnes, and be brand-new or 30 years old. So inside each type we bin
ships by maritime size-class and 5-year age band (add_peer_groups in
common.py). The bands are fixed, domain-meaningful intervals —
deterministic and reproducible.
- Size classes — each type has its own size-class edges (e.g. bulk carriers: <40k, 40–65k, 65–100k, 100–200k, ≥200k tonnes DWT — Handysize…VLOC).
- Age bands — universal 5-year bins: [0,5) [5,10) [10,15) [15,20) [20,25) [25+) years.
-
Minimum group size — a size×age cell with fewer than
PEER_MIN_COUNT = 15ships is merged with its neighbour (age collapsed first, since size is the more important peer axis) so every group is both interpretable and populous.
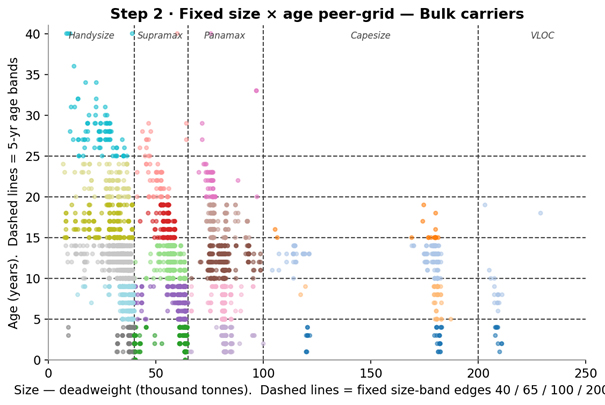
Across the 2024 fleet this produces 177 peer groups across 16 ship types (for bulk carriers alone, 22 groups). Each group is a real commercial segment a shipping professional would recognise on sight.
Step 5 — The grade: simplified CII rating
The A–E grade is the simplified Carbon-Intensity-Indicator rating — the single,
uniform grading standard used across every insight in the project (the grading
kernel lives in common.py: add_attained_cii → add_cii_rating). It is
computed in four sub-steps.
5a · Attained CII — what the ship actually emits per unit of transport work:
attained CII = CO₂e(g) / (Capacity × distance) = intensity(kg/nm) × 1000 / CapacityCapacity = DWT for cargo, GT for passenger/vehicle. This form is identical to AER for cargo ships.
5b · Reference and required CII — the IMO target line. Each CII ship-type has a reference line: a power law of capacity calibrated by the IMO. The required (target) line tightens the reference each year by a fixed reduction factor Z.
reference CII = a × Capacity^(−c)
required CII = reference CII × (1 − Z/100)
a, c are per-type IMO constants; Z is the IMO-fixed annual reduction (7% in 2024).
| CII type | a | c | d1 | d2 | d3 | d4 |
|---|---|---|---|---|---|---|
| Bulk carrier | 4745 | 0.622 | 0.86 | 0.94 | 1.06 | 1.18 |
| Tanker | 5247 | 0.610 | 0.82 | 0.93 | 1.08 | 1.28 |
| Container ship | 1984 | 0.489 | 0.83 | 0.94 | 1.07 | 1.19 |
| Gas carrier (<65k) | 8104 | 0.639 | 0.85 | 0.95 | 1.06 | 1.25 |
| General cargo (<20k) | 588 | 0.3885 | 0.83 | 0.94 | 1.06 | 1.19 |
| Ro-ro passenger | 2023 | 0.460 | 0.76 | 0.92 | 1.14 | 1.30 |
| Cruise passenger | 930 | 0.383 | 0.87 | 0.95 | 1.06 | 1.16 |
Table. Selected IMO CII reference constants and rating boundaries (sources MEPC.353(78), MEPC.338(76), MEPC.354(78)).
5c · Rebasing the target line onto CO₂eq. From 2024 the attained CII rides on CO₂eq, but the IMO reference line and d1–d4 are calibrated on plain CO₂. Comparing a CO₂eq attained against a CO₂ line would drift every grade stricter. So the reference line is lifted by each type's measured median CO₂eq/CO₂ ratio — reconstructing the line the IMO would have drawn on a CO₂eq basis. The type-median ship stays grade-neutral; only a ship's GHG profile relative to its type moves its grade.
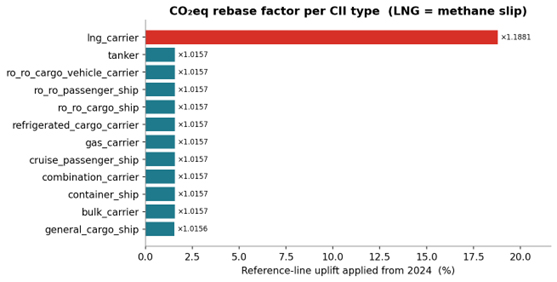
This is an empirical, admin-editable rebase, not an official IMO figure. Net effect: 98.4% of 2024 grades match the pure-CO₂ baseline; the movers are genuine GHG-profile outliers, dominated by LNG carriers.
5d · The CII ratio → the A–E letter. The grade is read off the ratio of attained to required against the type's four boundaries d1–d4 (the IMO "dd vectors"). A ratio of 1.0 means exactly on the year's target.
CII ratio = attained CII / required CII

ratio < d1 → A
d1 ≤ ratio < d2 → B
d2 ≤ ratio < d3 → C
d3 ≤ ratio < d4 → D
ratio ≥ d4 → E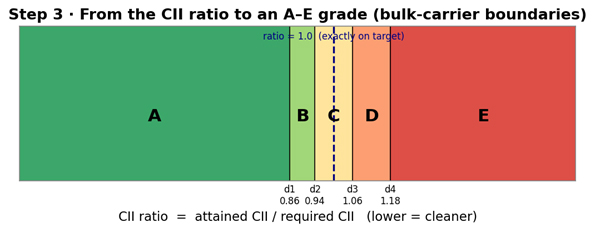
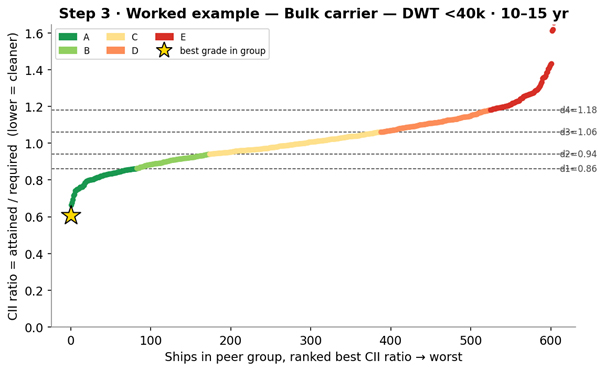
5e · The 0–100 efficiency score. For a continuous, comparable number (used to roll ships up into the Operator Score), the CII ratio is mapped to a 0–100 score, anchored to the same rating bands: each A–E band occupies a 20-point range. 100 = far below target (very clean); 0 = far above.
ratio at {0, d1, d2, d3, d4, 1.5×d4} → score {100, 80, 60, 40, 20, 0}piecewise-linear between anchors, clamped to [0, 100].
Rank, best-in-class, and technical efficiency
The CII rating is an absolute (regulatory) grade. Two extra signals add commercial context, computed on the operational metric (AER / pax-intensity), not the CII ratio:
- fleet_rank — a 0–100 percentile position within the ship's type (100 = cleanest of its type). A relative position, not a grade.
- benchmark_imo — the IMO of the single lowest-intensity (best) ship in the ship's peer group — the realistic standard every peer can aim at, because they are the same type, size, and age.
Why the best-in-class gap is the actionable signal. Within a peer group, the dirtiest ships sit alongside the best-in-class ship — same type, size, and age — yet emit markedly more to do the same job. That gap is not about the ship's design; it is operational (sailing speed, hull cleanliness, engine maintenance, routing) and therefore fixable. The laggards are, in effect, a shortlist of the cheapest available emission cuts.
Alongside the operational CII grade, each ship carries its technical-efficiency design index (EEDI / EEXI) as a separate, ungraded readout. The card shows the design-index value and the ship's within-type rank, but no A–E letter: the IMO assigns no rating to EEDI/EEXI, so the project does not invent one. This keeps the single A–E standard meaning exactly one thing — the operational CII rating.
Worked example — one ship, end to end
To make the chain concrete, here is every step for one real ship from
mrv.db: a 2021-built Panamax bulk carrier (DWT 82,032; age 3 in 2024).
| Step | Quantity | Value | How |
|---|---|---|---|
| Intensity | effective CO₂eq per nm | 302.6 kg/nm | co2eq_per_nmile (2024 → CO₂eq basis) |
| Distance | EU-scope distance | 32,016 nm | 9,537.7 t × 1000 / 297.91 (≥ 3,000 → in scope) |
| 5a | attained CII | 3.689 | 302.6 × 1000 / 82,032 ( = AER ) |
| 5b | reference CII | 4.167 | 4745 × 82,032^(−0.622) |
| 5c | rebased reference | 4.232 | × 1.0157 (CO₂eq rebase, bulk) |
| 5b | required CII (Z=7%) | 3.935 | 4.232 × (1 − 0.07) |
| 5d | CII ratio | 0.937 | 3.689 / 3.935 |
| 5d | grade | B | 0.86 (d1) ≤ 0.937 < 0.94 (d2) |
| 5e | efficiency score | 60.7 | interp. in the B band [0.86,0.94] → [80,60] |
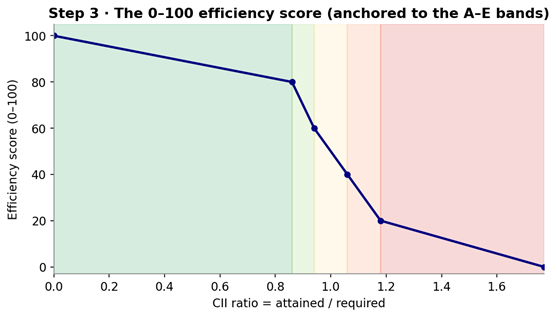
| 6 | fleet rank / peer | 80 / IMO 9975478 | cleaner than 80% of bulk carriers; group: DWT 65–100k · 0–5 yr |
Table. The full Peer Benchmarking computation reproduced from mrv.db. Every value matches the Ship Explorer card.
Reading it: a modern, efficient Panamax that lands just inside grade B — its CO₂eq intensity is 6% below its 2024 IMO target, cleaner than four out of five bulk carriers, but not quite in the top A band of its 0–5-year peer group.
Outputs, fleet result, and honest limits
Per ship the insight emits: the A–E grade, the 0–100 score, the CII ratio and its inputs, the peer group and its size, the within-type rank, the best-in-class peer IMO, and the technical design-index readout. Rolled across the fleet, the grades spread as a full distribution — because the grade is the absolute CII rating, the split is not forced to fixed percentages.
Why it makes sense and adds value. It is fair — a small old ferry is never judged against a brand-new mega-container ship, only against vessels in the same commercial reality. It is actionable — the gap between a laggard and the best-in-class ship in its own group is an operational, fixable target. It is standard-aligned — the grade is the recognised IMO CII rating, not a home-grown score, so charterers, lenders, and regulators can act on it directly.
Honest limits. Operator identity and CO₂eq are only published from 2024, so this is a 2024 snapshot. The CO₂eq rebase factor is an empirical measurement, not an official IMO figure, and should be re-measured if the fleet's fuel mix shifts. Ships under 3,000 nm are excluded, since their annual efficiency would be meaningless. Efficiency still reflects trade pattern — time at anchor, ballast legs — that peer grouping controls for type, size, and age but not every route effect. And the IMO's 5,000 GT mandatory threshold is deliberately not a gate here — smaller ships are graded too (flagged "indicative"), to give a full energy-efficiency picture.
The result is structured insight built entirely from public EU MRV data — intended to inform decisions, not to replace direct technical inspection of a vessel or operator.