
Plain question: how does a ship perform compared with other ships that are genuinely comparable to it?
The method, in short: cluster ships into real peer groups → score each ship's carbon intensity within its group → roll ship scores up into an operator score against operators with similar fleets → track each ship's year-on-year trend against its peers.
The point: the value of the EU MRV dataset isn't the raw number. It's the context around it.
01 / Context — Why shipping emissions need more than a number
The shipping industry has no shortage of emissions data. Since the introduction of the EU Monitoring, Reporting and Verification (EU MRV) framework, enormous amounts of information on ship fuel consumption and CO₂ emissions have become publicly available. The data is valuable — but raw data alone does not necessarily tell us which ships are genuinely performing well, which operators are falling behind, or where the greatest decarbonisation opportunities exist.
A simple ranking of ships by total CO₂ emissions is a good example. A large bulk carrier will almost certainly emit more CO₂ than a much smaller vessel. But does that mean it is less efficient? Not necessarily. The larger vessel is also carrying more cargo and travelling in a different operational context. Comparing the two purely on total emissions is therefore not really a comparison of efficiency — it is a comparison of scale.
The central question: how does a ship perform compared with other ships that are genuinely comparable to it? That question is at the heart of the Open Emission methodology.
02 / Peer benchmarking — start with the right peers, not the biggest numbers
The first principle is simple: like should be compared with like. Open Emission uses machine-learning-based clustering to create peer groups within each ship type. The clustering considers characteristics such as vessel size and age, allowing ships to be compared against vessels operating within a similar population.
A 32,000-DWT bulk carrier should not be judged against a 180,000-DWT bulk carrier simply because both are classified as bulk carriers. Likewise, a five-year-old container ship should not automatically be compared with a twenty-year-old vessel.
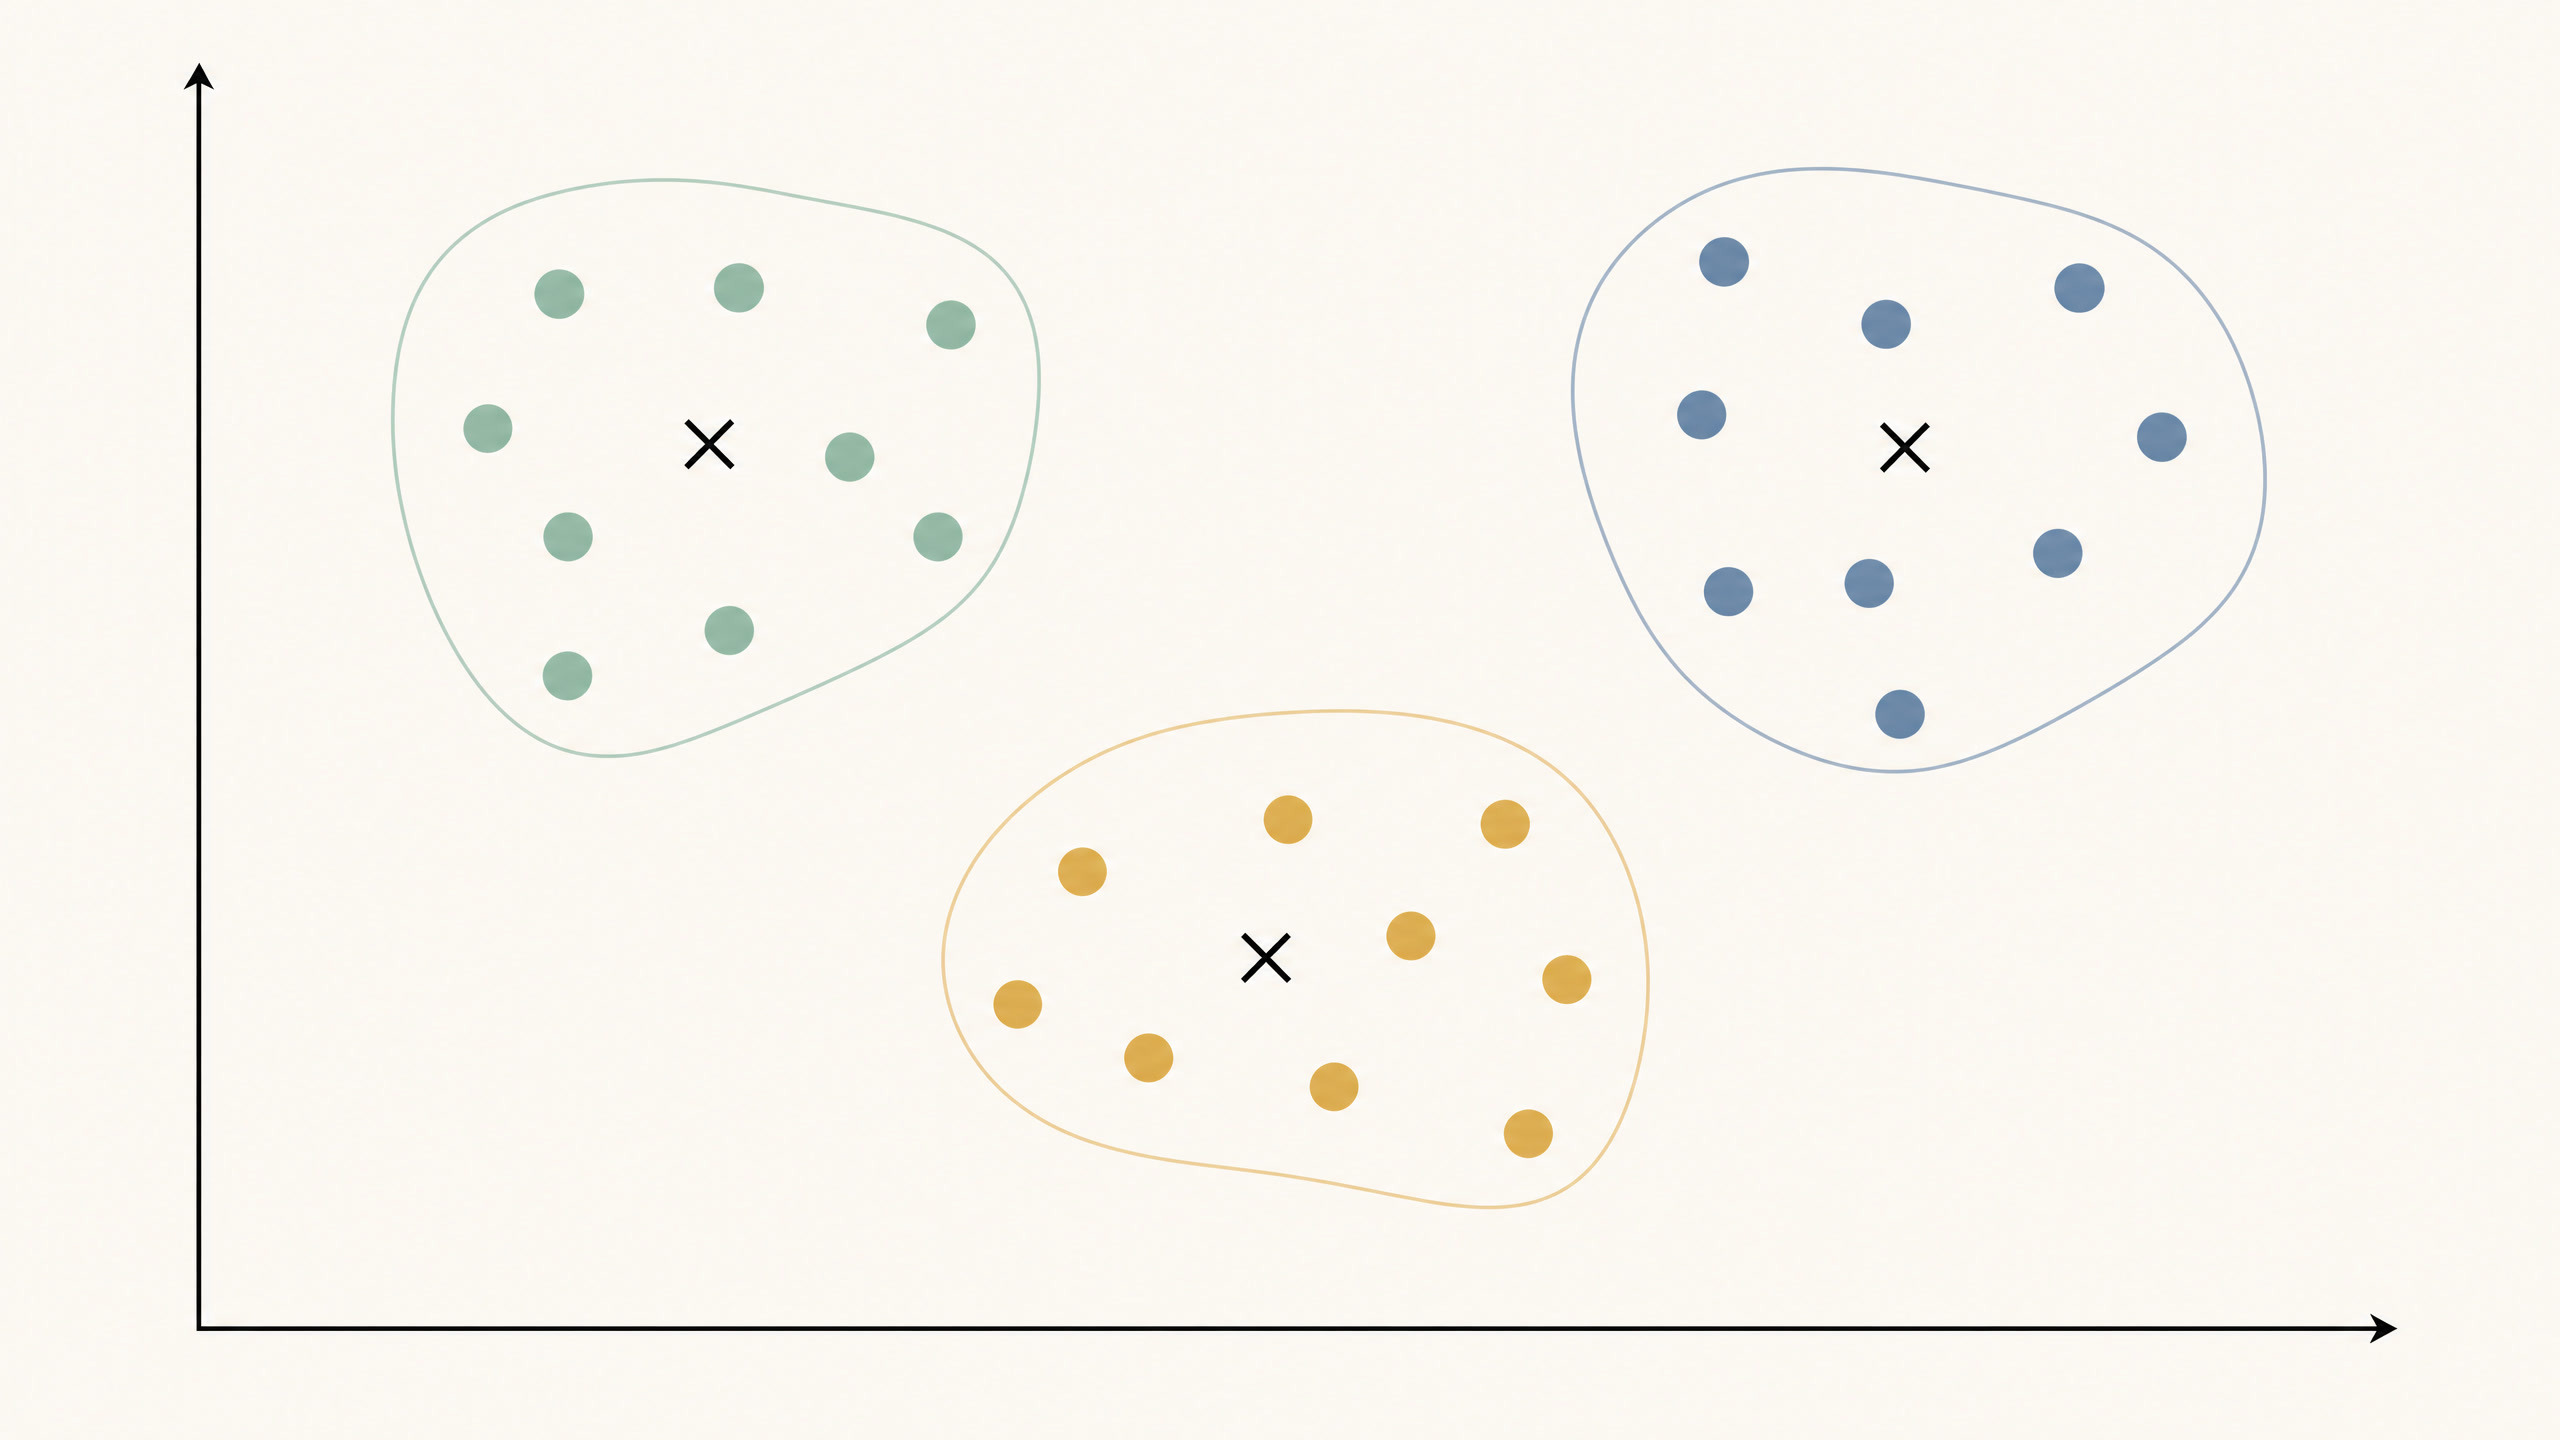
Once these peer groups are established, the analysis looks at carbon intensity rather than simply total emissions. Each ship's CO₂ performance is positioned against its peer group, producing a percentile-based performance ranking.
instead of: "How much CO2 does this ship emit?"
        ask: "How does this ship perform against vessels like itself?"
the shift from a raw total to a peer-relative percentile is what makes the comparison fair.
03 / Operator scoring — from ship performance to operator performance
Ships do not operate in isolation. A company's environmental footprint is ultimately determined by the characteristics and performance of the fleet it operates. This creates another problem: comparing operators using only total fleet emissions can be just as misleading as comparing ships by total emissions.
A company operating a large fleet of older, heavy-emitting vessels will naturally have a larger absolute footprint than a company operating a small modern fleet.
The operator question: how does an operator perform relative to other operators with similar fleets?
Open Emission addresses this in two stages.
- Score the ships — individual ship performance is converted into comparable percentile scores. These ship-level scores are then aggregated into an operator-level score using a weighted approach.
- Find real peers — a fleet fingerprint captures the characteristics of the operator's fleet, and cosine similarity identifies companies operating broadly similar fleets.
This means an operator is not simply compared with an arbitrary list of shipping companies. Instead, the analysis asks a more meaningful benchmark question — how are you performing compared with companies operating a fleet similar to yours? — which is a far more useful basis for strategic decision-making.
04 / Year-on-year trend — improvement matters as much as current performance
A ship's current position tells only part of the story. Imagine two vessels that currently have similar carbon intensity. One has been steadily improving year after year, while the other has remained essentially unchanged. Looking at one year's data, they may appear similar. Looking at their trajectory, they are very different.

Open Emission therefore examines year-on-year carbon-intensity performance and calculates the rate at which a ship is improving. This is expressed as Carbon Annual Intensity Reduction (CAIR). The important part is not only the ship's improvement rate, but how that rate compares with its peers.
A ship operating within a sector where most vessels are improving slowly may become a leader by improving slightly faster than the group. Conversely, a ship in a rapidly improving peer group may actually be falling behind even if its own emissions are declining.
The principle: progress has to be measured in context.
05 / Analytical structure — the value is not the algorithm, it is the context
Terms such as clustering, percentile scoring, cosine similarity and regression can make emissions analysis sound complicated. But the objective is actually straightforward: transform a very large public dataset into answers to practical maritime questions.
| # | Question |
|---|---|
| 01 | Which ships are performing well? |
| 02 | Which ships are underperforming against comparable vessels? |
| 03 | Which operators are outperforming their real peers? |
| 04 | Are vessels improving quickly enough? |
Table. The practical questions the analysis is built to answer.
That is the difference between data and intelligence. The EU MRV dataset provides the data. Statistical and machine-learning methods provide the structure. But the real value comes from putting the results into a maritime context that owners, operators, technical teams, charterers, investors and regulators can actually use.
06 / Decision context — from reporting to insight
For years, shipping has focused heavily on collecting environmental data. The next step is learning how to use it better. A database containing millions of records is not, by itself, a decarbonisation strategy. The real opportunity comes from asking better questions of the data:
- Who are my true peers?
- Where do I stand against them?
- Am I improving faster or slower than the market?
It is an attempt to move maritime emissions analysis away from raw numbers and towards context, benchmarking, trajectory and action. Because in shipping, the most important number is rarely the number by itself.
Final thought: it is what that number means.
Source methodology: openemission.com/methodolgy.html