
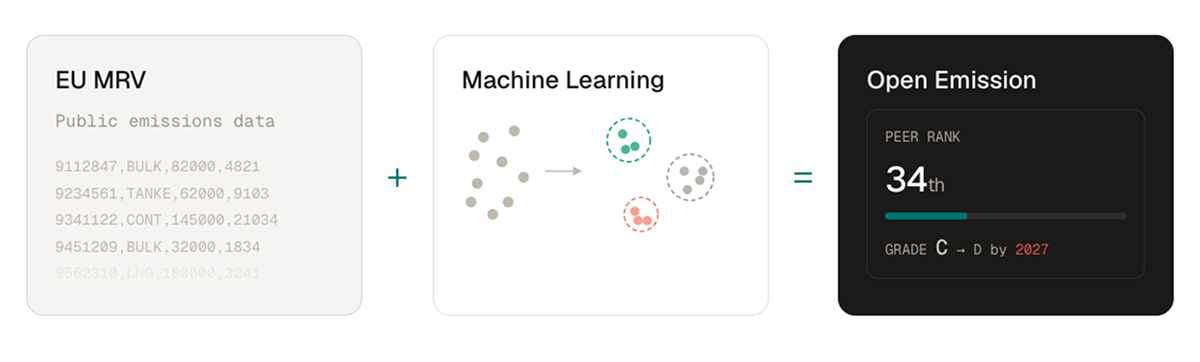
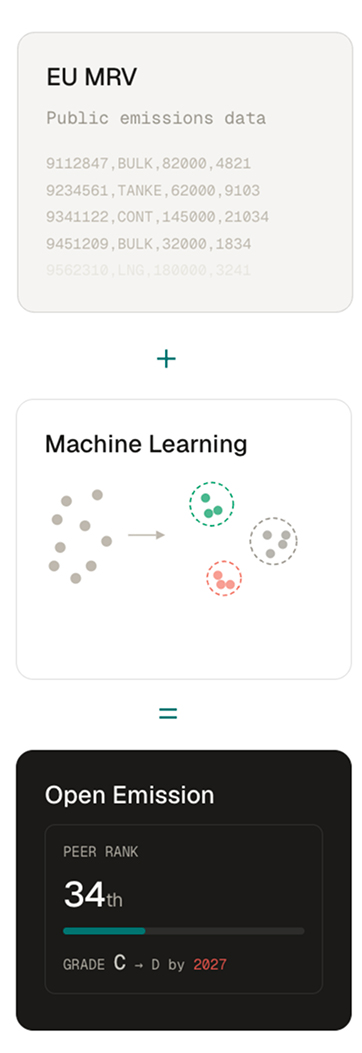
EU MRV (Public emissions data) + Machine Learning

EU MRV (Public emissions data) + Machine Learning

Open Emission

Ship Illustration

Maritime emission analysis and EU MRV intelligence — built from public data, powered by machine learning. 

The demo runs on sample data only, not live records. It is there to give a feel of the application, not to report real figures.

View Demo
01/

THE WHY

Cutting emissions starts with understanding them. EU MRV analysis has been possible since 2018, when the regulation began publishing millions of data points on ship emissions. but that raw data is hard to use.

A ship's true performance is more than just its total emissions. You need to compare it to its true peers, track its year-on-year improvement, and understand what its future might look like under the new CII rules. The same approach works for operators, comparing their entire fleet's performance against similar companies.

Open Emission takes complex, public EU MRV data and turns it into ship emission intelligence you can actually act on — the story behind the numbers, and where you stand in it.
02/

THE DATA

Since 2018, ships calling at European ports have reported their fuel use and emissions under the EU MRV regulation. This public dataset is the foundation for every maritime emissions analysis we produce.

22,551

unique ships

90,745

ship-year records

Since 2018

seven years of coverage

152.5 Million tonnes

CO₂ reported in 2024
03/

THE METHOD

We apply machine learning algorithms to EU MRV data for ship emission analysis.

Peer grouping uses clustering techniques to identify genuinely comparable vessels based on type, size, and age. Life-linear regression measures how each ship's carbon intensity is changing over time. Cosine similarity finds operators running similar fleets.

The output is ship emission intelligence: statistical analysis, openly documented and reproducible from the public EU MRV records.

04/

THE OUTPUT

Following are some of the deep insights that we get.

Peer Benchmarking

01

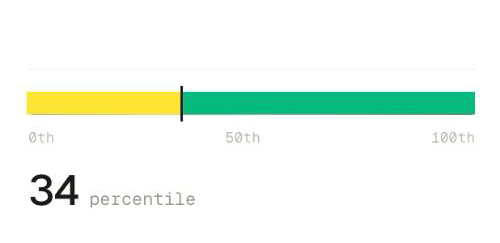
Where each ship's emission pattern sits among its true peers — vessels of similar type, size, and age.

Peer Benchmarking Graph

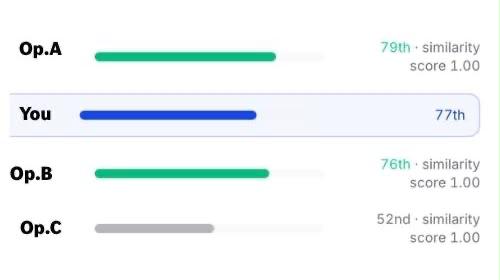
Operator Score

02

Where each company's emission pattern sits among operators running similar fleets.

Operator Score Graph

Ship Rankings

03

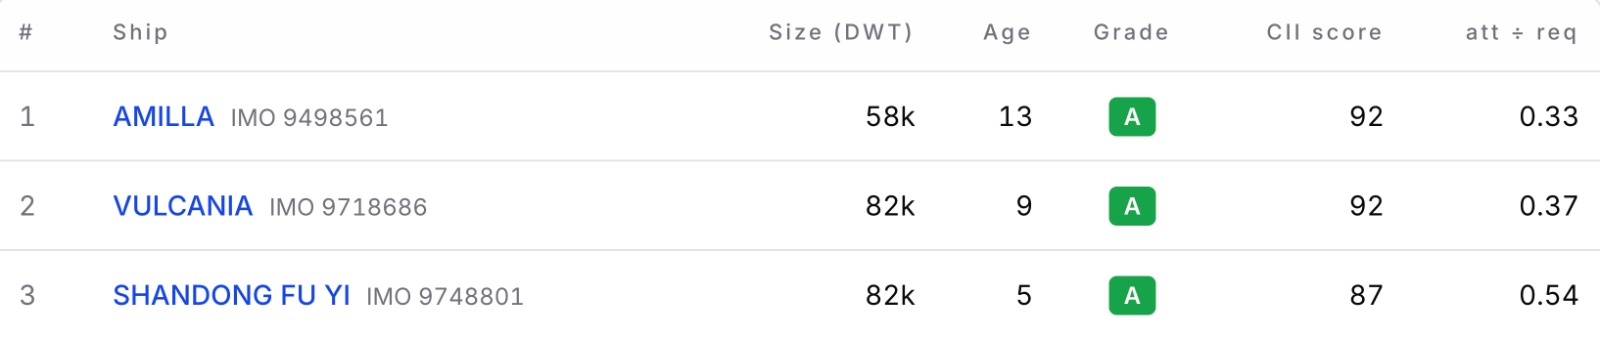
Statistical performance positioning across the entire EU MRV fleet, segmented by type.

Ship Rankings

Voyage Analysis

04

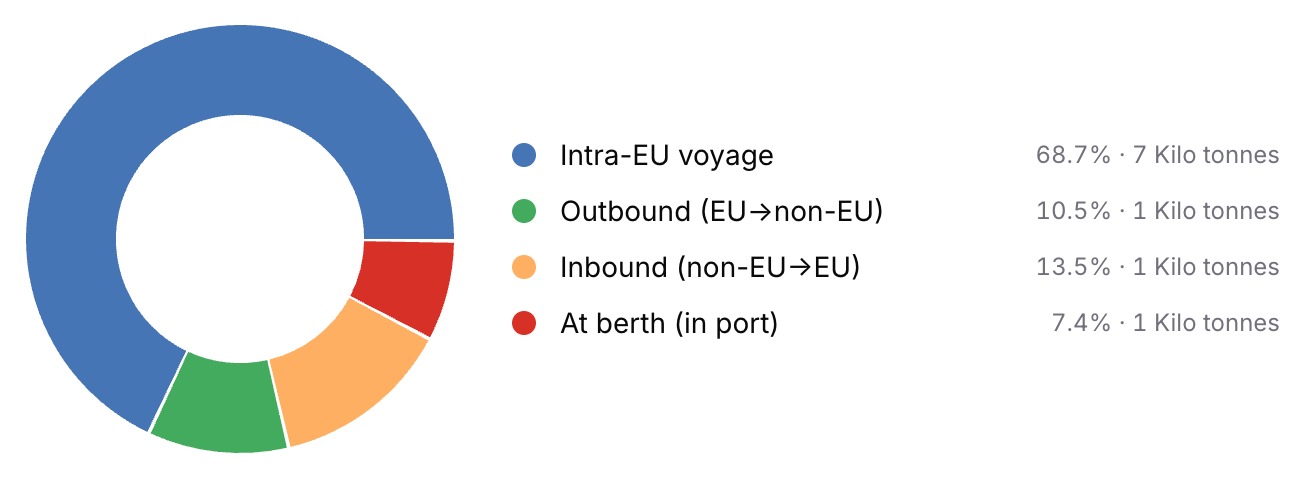
The breakdown of where a ship's emissions actually occur — at sea, on international legs, or at berth.

Voyage Analysis

CII Projection

05

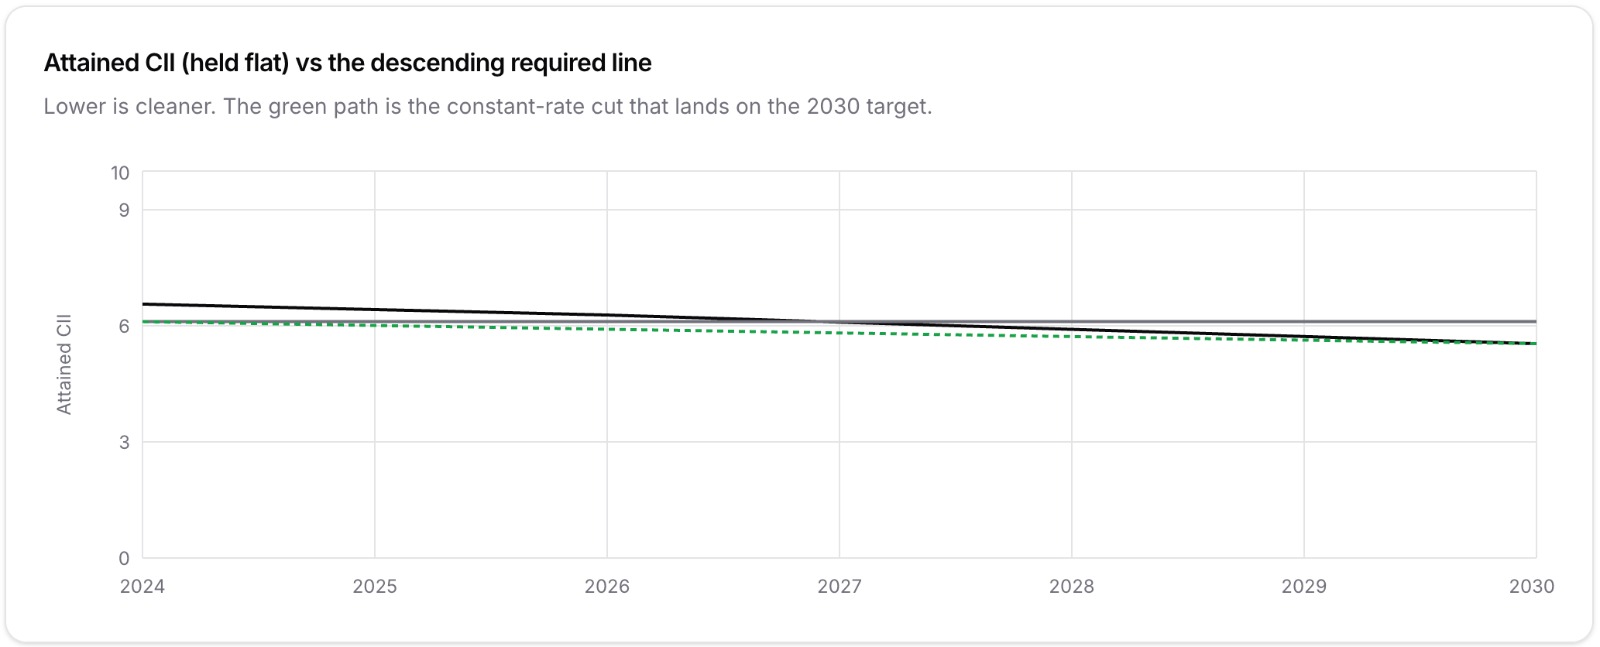
A simplified CII projected forward to 2030. The year each ship is likely to slip from C to D or E.

Year-on-Year Trend

06

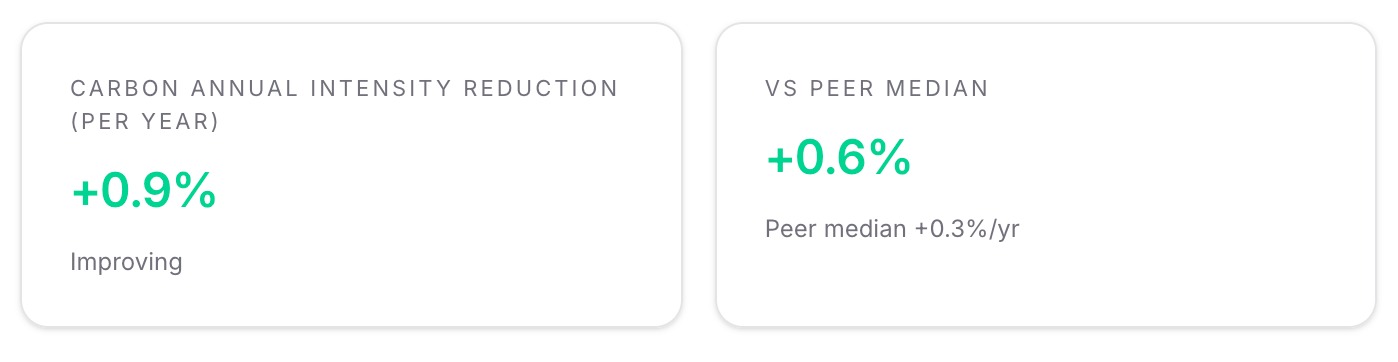
The change in a ship's emission pattern compared to the change among its peers.

YOUR CIIR

−2.4% ↓

per year

PEER MEDIAN

−0.9% / yr

1.5 pts above peers ↑

Fleet Overview

07

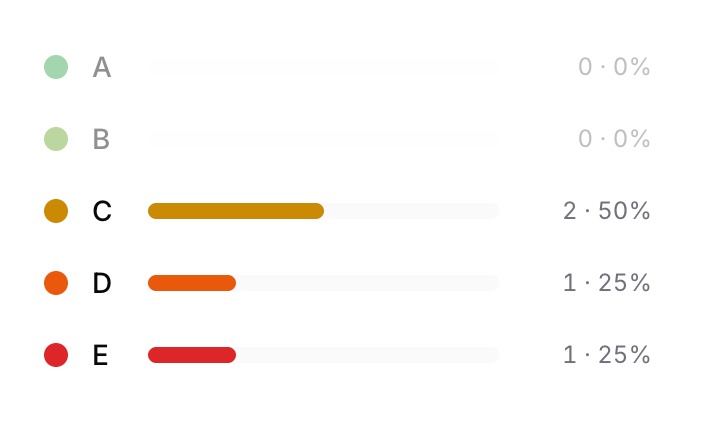
A snapshot of each operator's fleet. The focus is on the share of emissions coming from D and E rated ships — because that is where the real decarbonisation effort needs to go.

HUMAN – AT THE HELM

Built on subject-matter expertise and experience spanning two decades in naval architecture, ship management, new building, classification, and flag administration.

“Ithaca gave you the marvelous journey. Without her you wouldn't have set out. She has nothing left to give you now. And if you find her poor, Ithaca won’t have fooled you. Wise as you will have become, so full of experience, you’ll have understood by then what these Ithacas mean”

OPEN EMISSION